Custom Query (780 matches)
Results (13 - 15 of 780)
| Ticket | Resolution | Summary | Owner | Reporter |
|---|---|---|---|---|
| #1220 | fixed | log scale 2D data with zeros and negative values not plotted correctly | GitHub <noreply@…> | pkienzle |
| Description |
Sasview 4.2 Zero and negative values not plotted appropriately in log scale for 2D data. Plotter should add invalid values to the mask. Could instead use a transform something like the following: data = data.copy() zmin = min(data[data>0])/2 if (data>0).any() else 1 data[data<=zmin] = zmin return log10(data) If you know it is counts data, then log10(data+1) is good enough for visualization. You may still have a problem with spurious cancellation, for example when looking at background subtracted data, where you might end up with values like 1e-100 while the majority of the values are much higher. Setting the cutoff for masking at ½ the 5th percentile, np.quantile(data[data>0], 0.05)/2, instead of min(data[data>0])/2 would be better. |
|||
| #1212 | fixed | Bug in Iqxqy plotting non rectangular / square matrices? | ricardo | ricardo |
| Description |
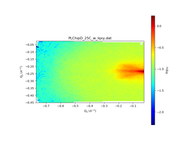
My users are complaining about SASView giving negative Y Axis for the following dataset: https://pastebin.com/raw/buBiU5JG This is what sasviews gives: This is what I get with Matplotlib: This data is not a squared Maxtrix (looks more a sparse matrix): In [3]: data = np.genfromtxt(filepath, skip_header=2, names="qx, qy, iqxqy, err" ...: ) In [4]: qx, qy, iqxqy, err = data['qx'], data['qy'], data['iqxqy'], data['err'] In [5]: len(np.unique(qx)) Out[5]: 78 In [6]: len(np.unique(qy)) Out[6]: 94 In [7]: len(qx) Out[7]: 6978 In [8]: len(qy) Out[8]: 6978 In [9]: 78*94 Out[9]: 7332 |
|||
| #1206 | fixed | Incorrect (and confusing) presentation of dQ from data in instrumental smearing section | GitHub <noreply@…> | butler |
| Description |
Selecting use dQ Data currently displays dQ high and dQ low (for pinhole data at least), However dQ low is not labelled while dQ high is labelled as dQ[%]. Prior to SasView version 4.1.0, the two values were labeled dQ high and dQ low. In 4.1.0 a change was made to the custom pinhole to be useful by asking for a dQ/Q in percent (see #850). The current labels probably were introduced accidentally in that work. However the proper fix should be to change the values presented to be dQ/Q[%] (as one label suggests) and then fix the labels to make it clear what is presented: dQ/Q low[%] and dQ/Q high[%]. |
|||

