Opened 8 years ago
Closed 6 years ago
#850 closed defect (fixed)
Custom pinhole smearing is broken?
| Reported by: | Federica Sebastiani | Owned by: | krzywon |
|---|---|---|---|
| Priority: | blocker | Milestone: | SasView 4.1.0 |
| Component: | SasView | Keywords: | |
| Cc: | Work Package: | SasView Bug Fixing |
Description (last modified by ajj)
Federica Sebastian - student at LU noticed a problem with the custom smearing in SasView? 4.0.1 …
Setting values in custom pinhole smearing gives a different answer to loading the same values from a data file.
Some instruments do not provide resolution information - hence the need for the custom smearing.
Taking data set and calculating a, say, 8% dQ/Q and putting that in the file as the 4th column behaves as expected.
Generating a custom pinhole smear with *the same dQ_low and dQ_high* as the dataset with "fake" resolution column gives a completely different answer and blows the curve out.
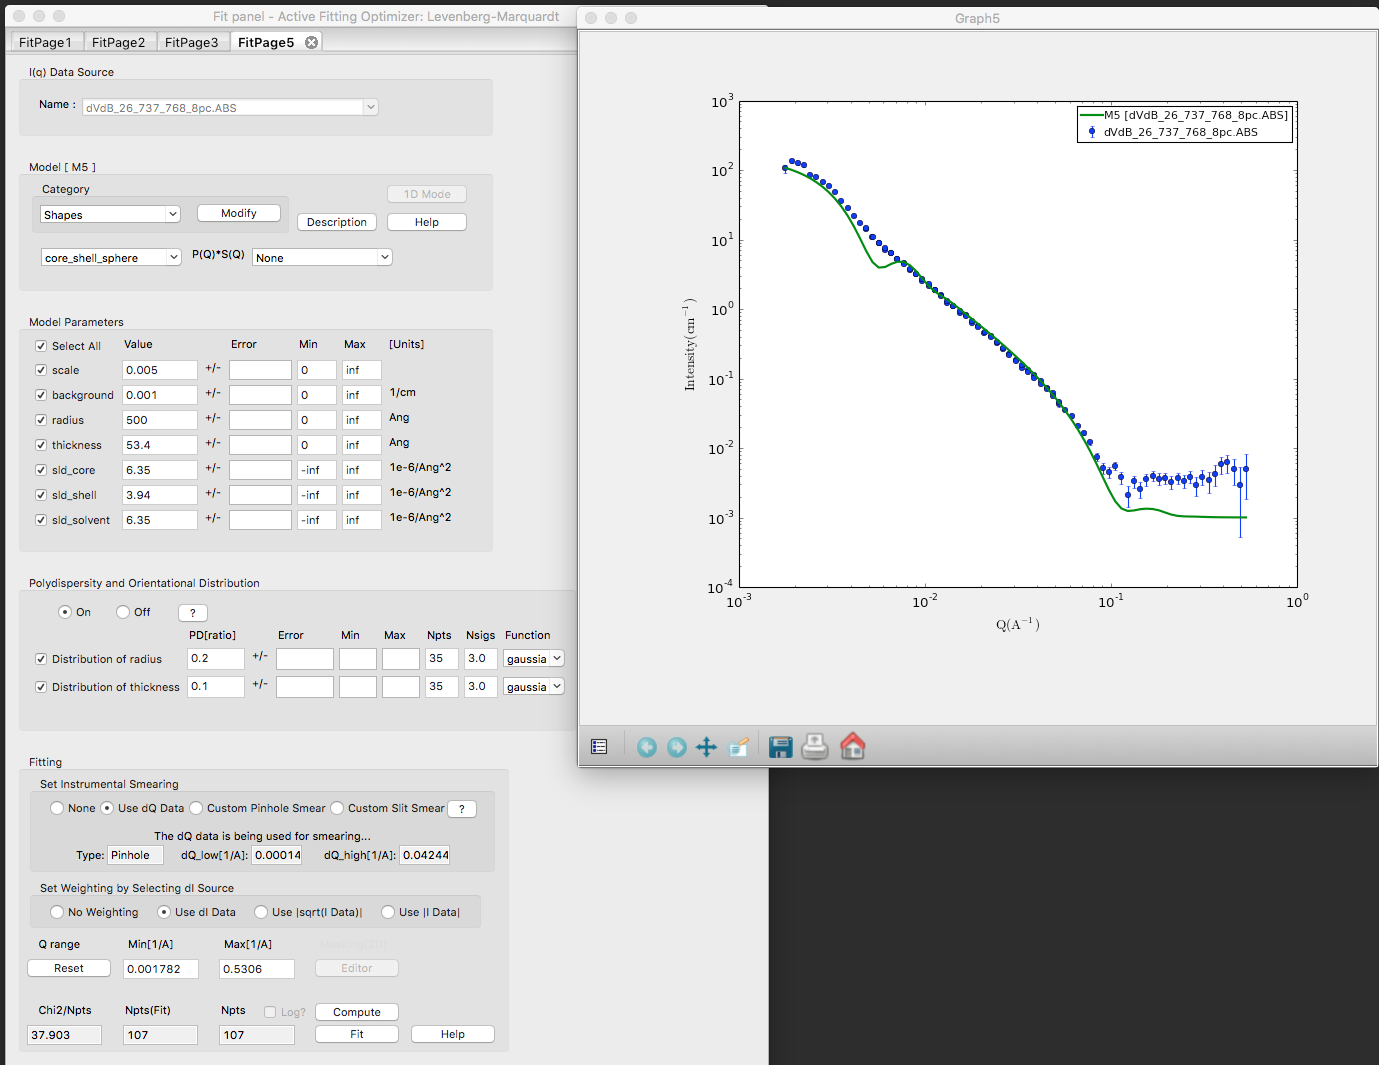
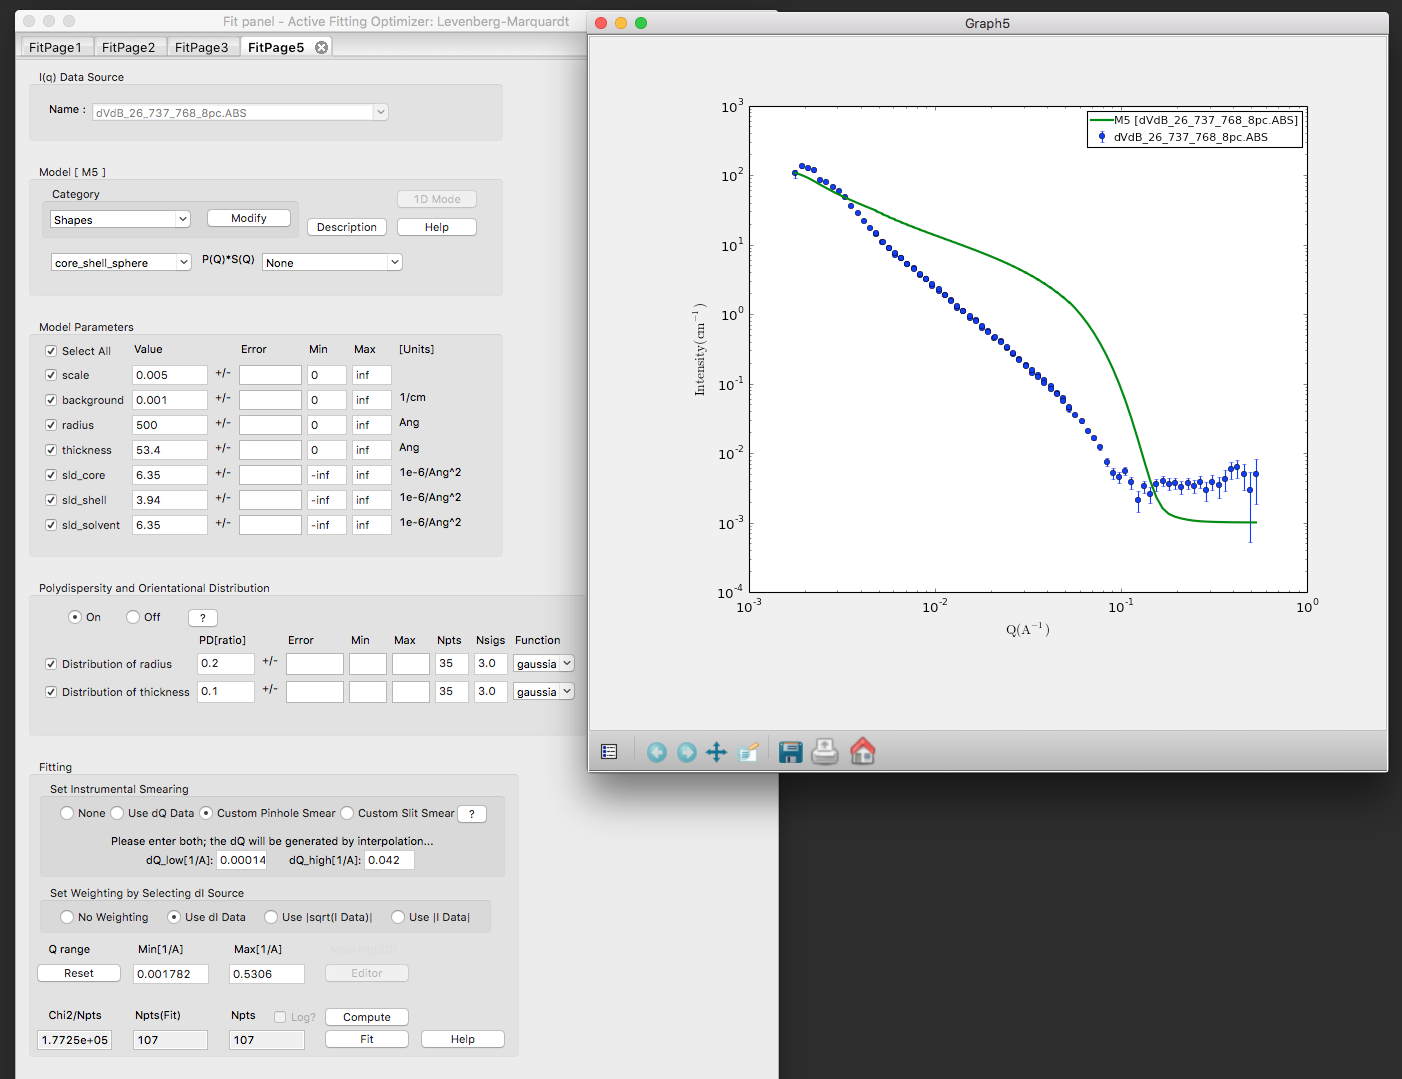
Attached images are for the attached data set with
(a) resolution from dQ data which was faked in the file.
(b) resolution from a custom pinhole smear using the same dQ_low and dQ_high
Attachments (3)
Change History (19)
Changed 8 years ago by ajj
comment:1 Changed 8 years ago by ajj
- Description modified (diff)
- Reporter changed from ajj to Federica Sebastiani
comment:2 Changed 8 years ago by smk78
- Owner set to wojciech
- Status changed from new to assigned
comment:3 Changed 8 years ago by krzywon
- Owner changed from wojciech to krzywon
comment:4 Changed 8 years ago by krzywon
Custom pinhole smearing creates a dq array of linearly interpolated values between min and max q, with no relation to the data set, in stark contrast to the faked dQ values which are a percentage of Q. To me, it seems wrong the dQ have no relation to the actual data and think it should be changed. How should this change?
I can think of two better ways, but am open to better suggestions:
(1) A percentage of q. I could change the input to a single value of %q.
(2) A linear interpolation of %q based on the input min and max dq.
fitpage.py lines 2348-2351 where the custom values are calculated:
step = (self.dx_max - self.dx_min) / (len_data - 1)
data.dx = numpy.arange(self.dx_min,
                       self.dx_max + step / 1.1,
                       step)
comment:5 Changed 8 years ago by krzywon
After a discussion with Paul, I thought I should clarify my last comment:
The custom pinhole smearing is working exactly as the code is written. This option computes dQ for each Q value that is linearly interpolated between the set minimum and maximum, but these dQ values are not based on the Q values. In the data file the faked dQ values were 8% of Q across the entire Q range.
The confusion stems from the difference in behavior between how dQ pinhole smearing and custom pinhole smearing work. If the minimum and maximum dQ are the same in the two cases, the results are different, but that is because the intermediate dQ values will likely not be the same.
The question I was asking and still have: should we keep custom pinhole smearing as it is currently or should we change how the intermediate dQ values are calculated to better represent reality? I offered two ways to do this; (1) a fixed percentage of Q regardless of the Q value, or (2) a variable %Q, interpolating between the %Q values calculated using the input min and max dQ.
comment:6 Changed 8 years ago by ajj
If that is how the custom smearing is working, then that is terrible, since the Q values might be spaced logarithmically and also the code should at least try to make some approximation to what a "real" resolution function might look like. I should have checked the code, clearly. As is it is essentially useless.
I had assumed that it was calculating dQ/Qmin and dQ/Qmax, interpolating between those values and applying that interpolated dQ/Q value at each corresponding data point.
i.e. something like (pseudocode not related to real sasview):
 step = (dx_max/q_max - dx_min/q_min) / (len_data -1)
 data.dx = numpy.arange(dx_min/q_min,dx_max/q_max,step)*data.qvals
and that doesn't handle the real distribution of Q values / assumes they are linearly spaced and that it is reasonable for the resolution to work that way.
I would tend to think that we need to provide:
(a) constant dQ/Q (cue argument about sigma vs fwhm etc etc)
(b) a tool to calculate a Mildner/Carpenter resolution if you have single detector distance data
© the interpolation approach, which might need to be smart about the distribution of Q values, but which is a bit dangerous if it doesn't equate to (a).
comment:7 Changed 8 years ago by krzywon
I edited my last comment. I meant pinhole smearing in each case I said slit smearing.
comment:8 Changed 8 years ago by butler
OK … am confusing myself a bit here. but understood dq and not dq/q is being used in custom pinhole. But given a dqmin and a dqmax there is a (dq/q)min and a (dq/q)max. A linear interpolation of dq should be the same as a linear interpolation over dq/q? or are you saying, as maybe Andrew is suggesting, that the interpolation is linear over the number of points (i.e. point 50 out of 100 has a dq = ½(dqmax - dqmin)?
If this is the case we MUST FIX NOW as I agree that makes absolutely zero sense (i.e. this is a blocker for 4.1 in my view). Even if it is "sensible" it would be preferable to change the input from dq to dq/q or %dq/q from my point of view. However not sure that needs to be done for 4.1
If we do need to fix, how hard to make it do what I think we thought it was doing (ie. interpolate linearly along q)? Or more precisely what which of proposed solutions would be simplest to implement for 4.1)
comment:9 Changed 8 years ago by krzywon
"point 50 out of 100 has a dq = ½(dqmax - dqmin)" - This is exactly what is happening. Ugh.
I know where the calculation is in the code, so changing it is straight forward, but what I should change it to seems open for some debate.
comment:10 Changed 8 years ago by butler
In that case I agree with Andrew. Let me start over.
WHAT?!!!!
INCONCEIVABLE! (yes - a classic quote ![]()
OK so I think the short answer is whatever can be done most easily that is sensible and doesn't introduce too much new discussion. I guess I would vote for dq/q as what is entered and interpolating linearly. eventually may want to add a functional form to dq/q but not for 4.1. By setting both min and max the same would thus be equivalent to a single value of dq/q but does give a bit more flexibility if desired and meand the GUI has not so much to change (i.e. the nubmer of boxes stays the same).
comment:11 Changed 8 years ago by krzywon
comment:12 Changed 8 years ago by krzywon
comment:13 Changed 8 years ago by krzywon
comment:14 Changed 8 years ago by GitHub <noreply@…>
- Resolution set to fixed
- Status changed from assigned to closed
comment:15 Changed 6 years ago by smk78
- Milestone changed from SasView 4.1.0 to SasView 4.3.0
- Resolution fixed deleted
- Status changed from closed to reopened
The original fix for this ticket modified Custom Pinhole Smearing to accept dQ as a constant % of Q (though this was a path of least resistance amongst several alternatives as earlier comments discuss).
I have reopened this ticket because it has become apparent that when dQ is read from the datafile, ALL VERSIONS OF 4.X, INCLUDING 4.2.0 are actually misreporting dQ in the FitPage.
In 3.1.2, when Use dQ Data was selected the FitPage showed the type of smearing (eg, Pinhole), dQ_min[1/A] and dQ_high[1/A]; the latter two values being the dQ values on the first and last points in the datafile.
In 4.x, when Use dQ Data is selected or auto-selected, the FitPage shows the type of smearing, dQ-min[1/A] - although this is not labelled as such - and dQ[%], except this last value is not the %dQ it is still dQ_high[1/A].
The codebase (see basepage.py and fitpage.py) seems to have some infrastructure for computing %dQ.
I think displaying the %dQ is probably of more use to the user, and we could flag "crazy" values by turning the reporting box(es) red or similar. But exactly what we report probably needs some discussion.
comment:16 Changed 6 years ago by butler
- Milestone changed from SasView 4.3.0 to SasView 4.1.0
- Resolution set to fixed
- Status changed from reopened to closed
Looking carefully, this ticket seems to have been about fixing dQ for custom pinhole smearing which was effectively broken. This was fixed in 4.1.0, though an improved option for doing so clearly remains open for a future enhancement ticket. This ticket was thus I think closed appropriately and reported as part of work completed in 4.1 and should remain closed under 4.1.0.
The new issue which granted was most likely accidentally introduced during the fix introduced by the work to close this ticket, is not about a structural flaw nor about custom pinhole resolution but about the way the resolution is displayed when using dQ from Data. I have opened a new ticket under 4.2.1 (rather than 4.3 as discussed at today's meeting) to cover this new bug and will copy some of the relevant suggestions over. This also makes the ticket less confusing since it states immediately what the actual problem is that needs solving.
Data file with faked dQ values at 8% dQ/Q