#1212 closed defect (fixed)
Bug in Iqxqy plotting non rectangular / square matrices?
| Reported by: | ricardo | Owned by: | ricardo |
|---|---|---|---|
| Priority: | major | Milestone: | SasView 4.2.1 |
| Component: | SasView | Keywords: | plot |
| Cc: | Work Package: | SasView Bug Fixing |
Description
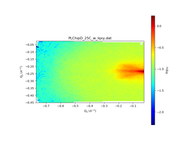
My users are complaining about SASView giving negative Y Axis for the following dataset:
https://pastebin.com/raw/buBiU5JG
This is what sasviews gives:
This is what I get with Matplotlib:
This data is not a squared Maxtrix (looks more a sparse matrix):
In [3]: data = np.genfromtxt(filepath, skip_header=2, names="qx, qy, iqxqy, err"
   ...: )

In [4]: qx, qy, iqxqy, err = data['qx'], data['qy'], data['iqxqy'], data['err']

In [5]: len(np.unique(qx))
Out[5]: 78

In [6]: len(np.unique(qy))
Out[6]: 94

In [7]: len(qx)
Out[7]: 6978

In [8]: len(qy)
Out[8]: 6978

In [9]: 78*94
Out[9]: 7332
Change History (8)
comment:1 Changed 7 years ago by ricardo
- Summary changed from Bug in Iqxqy plotting not non rectangular / square matrices? to Bug in Iqxqy plotting non rectangular / square matrices?
comment:2 Changed 7 years ago by pkienzle
comment:3 Changed 7 years ago by ricardo
Just did some debugging.
The problem appears to be in sas/sascalc/dataloader/file_reader_base_class.py FileReader::_remove_nans_in_data (line 218).
Before calling this function (line 273) both ymin and ymax are good.
comment:4 Changed 7 years ago by pkienzle
Look at line 278:
dataset.Ymax = np.max(dataset.qX_data)
comment:5 Changed 7 years ago by ricardo
- Owner changed from mathieu to ricardo
- Status changed from new to assigned
comment:6 Changed 7 years ago by ricardo
comment:7 Changed 7 years ago by pkienzle
- Resolution set to fixed
- Status changed from assigned to closed
comment:8 Changed 7 years ago by butler
- Milestone changed from SasView 4.3.0 to SasView 4.2.1
Note: See
TracTickets for help on using
tickets.


Confirmed the behaviour in current master.
The bug is in the assignment of qy values in the 2D data, not in the plotting. Plotting uses equal axes. Since the qx range of the displayed data is twice the qy range, the image appears horizontally stretched and vertically squashed.
The error is could be in the loader not preserving the qy values correctly, or in the conversion of the data into uniform steps in qx/qy, or most like to the final assignment of the qy axis to the 2D array.