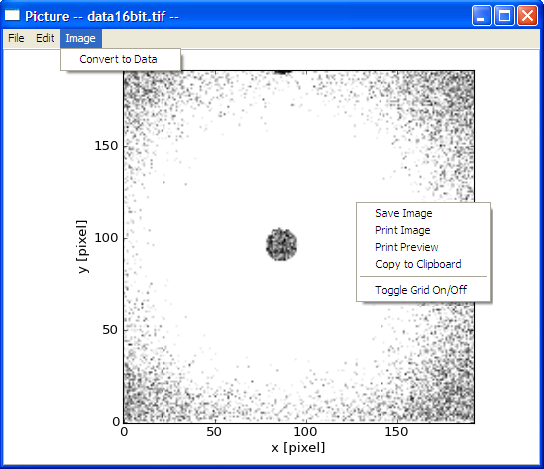
This tool is to load image files (in the format of png, bmp, gif, jpg, or tif) and to display it in the x-y coordinate (against the pixel number). The displayed plot then can be saved, printed, and copied. The plot can also be resized by dragging the corner of the panel.
1. Select 'Image Viewer' under 'Tool' menu in the menubar.
2. Select a file type from the drop-box at the bottom of the file dialog panel, choose a file of interest, and then click the 'Open' button (See Picture below).

3. If the loading is successful, the image will be displayed in the x-y coordinate. The file name will be shown in the title bar (See Picture below).
4. Some options such as Saving, printing, and copying are available from the menubar, or in the popup-menu by right-mouse-clicking anywhere in the plot (See Picture below).

5. If the image is taken from a 2D detector, it can be converted to our 2D data where the z values are computed by the Eq. z = 0.299R + 0.587G + 0.114B unless the picture file is formatted in an 8 bit Grey-Scale tif. In the "Convert to Data" dialog, users set the proper values in the text boxes and then click the OK button to close and to send the data generated to the Data Explorer in the SasView main window. The "Cancel" button will just close the dialog (See Picture below).
